Not too long ago, my friend Diego contacted me to solve a technical issue for an art event. He had this idea of a neon sign, well, two actually, the message was split in half with a strong change in meaning and he wanted the second half to activate once a visitor was actually observing the photos that carried other dimension to the message.
We talked for a while and ruled out motion sensors, people stay still while watching photos. I wanted to try those new time-of-flight distance measurement chips, but their field of view was extremely narrow and we needed to cover a 4-meter wide distance two meters away from the piece of art, and we couldn’t do anything to the lateral walls…
As not long ago I’ve been designing a liquid level measurement device based on Acconeer‘s radar chips, I suggested we could use two of them to cover the area.
Under “normal” circumstances I would design something specific with a microcontroller, develop in C, and rely on Mongoose or Mongoose-OS if I needed comms. We had little more than a month to do this, I was busy with other projects, the event would take place in Miami, I live several thousands of miles south, and my friend is an artist… Diego is computer literate, we met decades ago at the Amiga forums in the Fido network (yes, we used dial-up modems and sent already written messages), but I needed to be able to calibrate the radars and make corrections to the software from my place.
I suggested to use a Raspberry Pi with WiFi, a relay board to control the lights, and two radar modules with USB connection. Diego bought them all and soon had them connected at his place; he also added a subscription to VNC so we both were able to access the RPi behind firewalls.
I chose Python for the software, that would allow me to try things on the fly and modify at will with remote access. I wrote a couple of mock libraries and developed the software on my computer (I didn’t have a Raspberry Pi), I already had one sensor and the manufacturer library provided simulation for the second one.
One design choice was to use Paho-MQTT for communications. Not only would this device report any activity (that we could later analyze to take information on visitor activities), but I needed to be able to see what the radars were seeing in order to properly configure their gain and sensitivity.
Once developed, the software was uploaded to a Github repository, then I connected to the RasPi via VNC and cloned the repo there. The radar modules came without a firmware loaded, so I uploaded it to the RPi along with the microcontroller flashing tool, asked Diego to press the proper buttons (we communicated through Whatsapp) on the modules and flashed them. Wrote a small piece of code so he could test the relays, and everything was ready for the hard part.
The Python program reads both sensors raw data and using Acconeer Exploration Tool (in algorithm mode) processes five readings per second and measures the distance to the closest peak detected by a CFAR algorithm. If that peak is at the desired distance range, which we estimated at a visitor typical viewing distance from 60cm to 2.5m, the program activates the relay that turns on the complementary neon sign (though they actually are LED signs in neon color…) and keeps it on for 10 seconds after all activity ceases. Every action, and no action for 1 minute, is published on a well-known (for us) MQTT topic on HiveMQ’s free broker. We could then know if the device is working by just subscribing to that topic. Paho-MQTT runs as a separate thread, the whole program in the main thread.
Besides that, I also added a small set of RPC calls, the device listens on a topic and I, from my lab, publish questions asking the status and providing a rendezvous point (the topic where the device will publish its response) and get the average data, the threshold, and any detection, inside a JSON object. This is done with a separate Python program, also based on Paho, running on my workstation. This program then uses pyplot (I’m used to MATLAB so…) to graph the readings and provide me with an idea of what is going on in Miami.
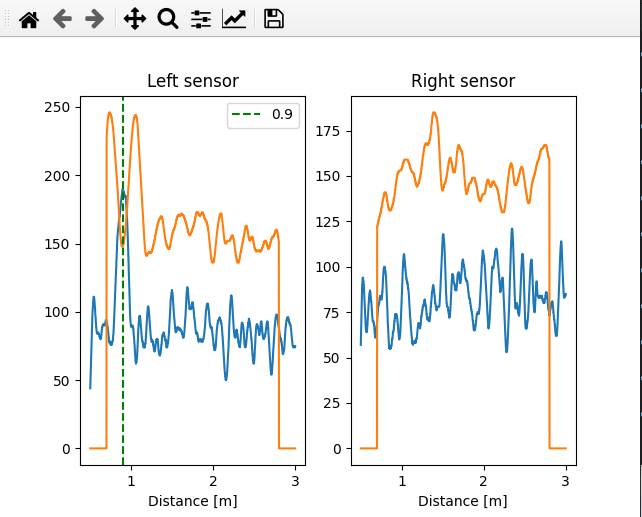
The hard part was finding the sweet spot of both sensor orientation and gain/sensitivity to achieve proper human detection with minimum false positives. We humans are not good microwave reflectors so the SNR was really poor. We asked but the art gallery personnel said dressing the visitors in full metal jacket was not an option, so Diego would walk the area phone in hand, texting me via Whatsapp, while I, 7000Km away, would watch the graphs and tweak gain and sensitivity.
Happily, we were able to get this device working OK right on time, and my friend enjoyed the reception at the art gallery while I grabbed a beer at home.