Que el post sea sin ilustrar, no significa que no sea ilustrado, o ilustre. Se trata de un pequeño compendio de algunas notas sobre la IoT que escribí para Cika. De hecho son links a su servidor.
“La internet de nuestras cosas“, mi visión de la IoT sin marketing, un enfoque técnico de posibilidades y cuándo usar cada una, a mi criterio.
MQTT. Te lo describo en pocas palabras desde un enfoque práctico. (Y no, según leí por ahí la ‘Q’ no era originalmente por ‘queueing’ sino por los equipos MQ de IBM, pero finalmente se introdujo como ‘message queueing’ en el nombre).
¿Qué es la Google Cloud Platform? ¿Me sirve? ¿Es cara? Todo depende, pero espero haberte sido útil.
¿Me quedo mejor con Amazon Web Services ? No la comparo, pero te describo lo que ve un desarrollador embedded con formación en comunicaciones. Entre nosotros, a mí la parte IoT Core me gusta más.
En este post voy a reunir los artículos al respecto que escribí para Cika Electrónica en mi último tiempo con ellos. De hecho se trata de links a su servidor…
No trabajo más en Cika y no creo que vaya a escribir otros artículos en castellano en el futuro, a menos que aparezca un mecenas (o conjunto de ellos) que incline el uso de mi tiempo en esa dirección mediante su aporte económico voluntario. Ergo, disfrutad de este contenido mientras aprendéis inglés o armáis una sociedad de fomento ad hoc.
“edGarDo”, una nota de aplicación con una idea de cómo hacer un control de portón de garage usando BLE e incorporándolo a openHAB para obtener control mediante Google Assistant y Alexa sin esfuerzo
Mongoose-OS tiene un esquema del tipo RPC (Remote Procedure Call) que entre otras cosas podemos decir que cumple la función de los CGI en un servidor HTTP. Cómo manejar la autorización: texto de la nota, código asociado
En ese link, durante la semana del 1 al 7 de marzo, vas a poder comprar mis libros con un 25%. Después, o antes, no vas a tener descuento, pero sí vas a poder seguir comprando mis libros…
Por qué sólo 25% y por qué comprarlos.
¿Por qué no? Porque si bien “el conocimiento es libre”, el tiempo del instructor no lo es, y escribir un libro no sólo requiere tiempo y ganas; para llegar a adquirir conocimiento hay que ponerle pilas a un tema y darle duro y parejo hasta que se lo entiende. Esto, a su vez, a veces además de conseguir la información pertinente requiere investigar, hacer experimentos, comprobar supuestas creencias, y hasta desarrollar algunas cosas que no se explican. Después, como si esto fuera poco, hay que ponerse a expresarlo en un lenguaje que sea lo suficientemente formal y entendible a la vez, apuntado al perfil de lector que se pretende. (Omítase aquí la sutileza de que además hay que haberse preparado en todos dichos aspectos).
Todo esto lleva mucho tiempo, el cual implica un costo pues dedicarlo a otra tarea mejor remunerada traería una mayor ganancia y para satisfacer algunas de las razones mencionadas es necesario además hacer una inversión. Lo que tiene valor, cuesta. Por eso, hasta que logre descender de una nave esotérica proveniente de otra dimensión y plasmar la sabiduría ancestral en un instante al solo mover de un dedo, mis libros van a tener un costo razonable. Si realmente lo necesitás, y realmente no lo podés pagar, existe algo llamado beca, que mediante alguna institución ad hoc se le aplica una transformada y lo llamamos cupón de descuento, el cual hemos demostrado que puede llegar al 100% si se cumplen ciertas condiciones de contorno.
Detto ciò, give your pocket crocodile a break and ci leggiamo presto.
On the previous article, we solved the problem of merging logs from different measurement instruments to investigate one aspect of a problem. Now, we dive into dealing with the embedded system itself.
The controller board
Due to cost, availability, mass production and more cost issues, the product in question is based on an 8-bit taiwanese microcontroller with support for reading touch pads but no ADC. The LDR here is a latecomer, and in order to be serviced I developed a capacitor discharge based way of determining if the LDR was seeing a day condition or a night condition. The I/Os have schmitt-trigger inputs, so I charge a capacitor and let it discharge over a resistor with a known value. I then repeat the operation but this time let it discharge over the LDR. The I/O threshold is not well defined but should remain the same between two consecutive measurements, so the unknown LDR resistance can be obtained as a ratio of the discharge times (write the discharge equations, solve for the threshold voltage, equate both eqs, then solve for the unknown resistance). The error is pretty big but as we just need to tell day from night, it works (the LDR itself is a bigger error source).
The procedure is then first measuring the discharge time with the known R, estimate a maximum for the discharge time with the LDR, and if it times out then condition is night, otherwise it is day… So, since this board communicates with a main controller (which handles all the bells and whistles of the device) there is an UART in there, and so I quickly modified the firmware to output the expected time lapse, the obtained time lapse, the decision (1 for day, 0 for night), and whether the LEDs where full bright or not (remember I’ve already modded it to alternate the LEDs…). I ended logging something like this:
 30,29,1,1
 30,29,1,1
 30,28,1,1
 30,29,1,1
 30,29,1,1
The first field is the expected timeout for declaring night condition, the second one is the measured discharge time through the LDR, the third one is the decision made, and the fourth and final field is the brightness of the LEDs.
We have here two types of variables: the known analog magnitudes we already processed as real entities, and these two new “digital” variables we will process as vectors. One bit vectors, to be precise.
As you’ve probably noticed, there are no timestamps in the log. The board has no notion of real time. Though it does have a notion of time, some parts of the code required assembly programming so it was easier to let things as simple as they are and take advantage of vcdMaker; as it is capable to infer time information from line numbers. This is possible because there is a known log speed: the board logs its measurements every 500ms (two times per second).
Finally, since this is a csv format, all variables have their data in each log line, and all will share the same timestamp. Then, all definitions will have the same line tag matching the record, but we will care for just one field for each variable. Furthermore, the timestamp tag will also be the same; pay attention to how we can convert lines of text to time information using the line() function call. So, this is what I came up with for the config file:
Since the expected and measured times are 8-bit integers, I captured them also as vectors (observe the size keyword), and finally at the end I re-captured them as reals to calculate the resistance value. The magic numbers there come from solving the equations with a known R that is 100K. To save some pins, the first measurement is actually R paralleled to the LDR and the second one is the LDR alone, so when solving the equation one gets LDR = R(t2/t1 -1) and the LDR value we use for threshold is 200K (2 times R), then t2 > 3t1 means we are at night.
Now we go to the board and capture its log with any serial tool, preferably one that can add timestamps so we can know for sure when we actually started logging, so having just the stamp for the first line will do, since vcdMaker will do the rest.
Since the board was outputting two records per second… 500ms units… the time base for the luminometer needed to be corrected to match the board one. As it outputs time with seconds precision, a simple multiply by 2 will do:
We have two different time frames. The board will start at 1 (the line number for the first line), the instrument logs real time. We already took care of converting the luminometer log to units of 500ms; matching the number of lines per second base from the board. So, we know logs can be matched but we still need to find the offsets to apply: to find the sync point and translate it to two offsets.
Since I knew when I started logging my board (it was on the log itself…), I visually inspected both logs and found the first board line whose time was coincident with a luminometer log entry. In this case, I found that line 8 of the board log coincided with the luminometer log at time 6:26:03. Converting the time of day to “seconds from midnight” and then to units of 500ms we get the number 46326 ((6*3600 + 26*60 + 3)*2 = 46326). So, to merge both logs into one vcd file, I apply both offsets, respectively:
Then, I visually inspected the generated vcd file and confirmed signals changed at the right moment as I saw on each log. So, the offsets were correct. For simplicity, forgive me telling the merger those are seconds (instead of half seconds) and let’s check for 10 second windows in the graphs (remember LEDs change brightness every 5 seconds).
The analysis
Now open gtkWave, open a new tab if necessary, load your vcd file, click on Top, append your signals, and…
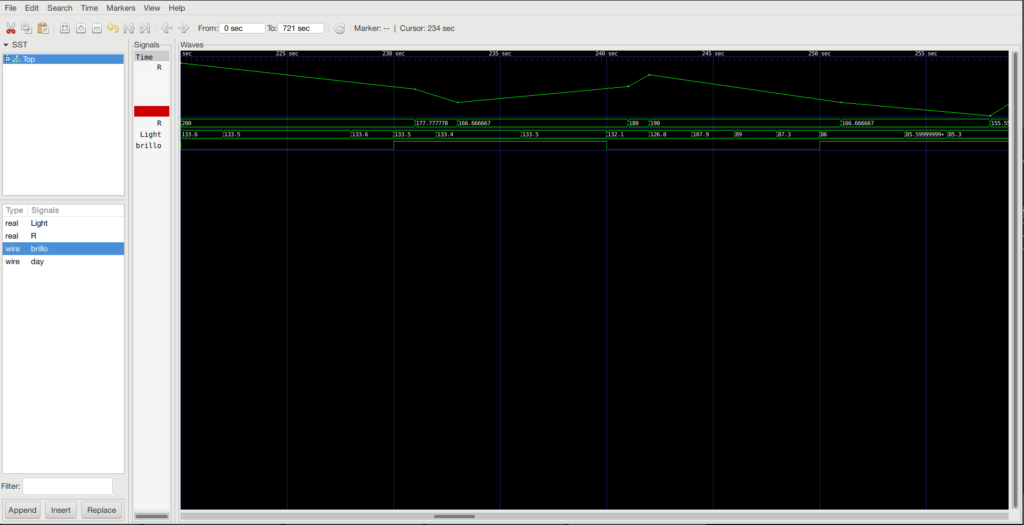
gtkWave showing the merged logs
We already new what was happening from the previous article, but now we can see what the board is measuring and declare guilty beyond any reasonable doubt.
Here I have this customer that asked for a design having unusually bright LEDs and an LDR to switch from day to night operation… and later added an opaque glass in front (that explains the unusually bright LEDs… but wait, things will get worse), and the whole assembly ended up leaking LED light into the LDR.
I knew there was leaking, that would explain the behavior this customer was observing, but since they claimed to have fixed it, I needed to prove it beyond a photograph. So, I quickly modified the board firmware to light the LEDs 4.5 seconds on, and then the same time off, and repeat, and jumped to do the measurements.
My lab has its limitations, the tools at hand were a set of asian-made logging luminometer and multimeter, plus what I could get out of the board. Furthermore, the light conditions barely let me see what I was doing, no way I could trustably see the measurements, take notes, and change light conditions at the same time. Welcome to the 21st century, our instruments now log their measurements and we will take advantage of that.
Things set up, I left the tools running and performed the changes to go from “night” to “day” and viceversa. I ended up with two beautiful logs; each instrument logged their measurements in two completely different spreadsheet-like formats. Yes, they were both the same brand. Yes, they were both sampling at the same frequency. No, they were not logging at the same frequency… there were repeated and missing timestamps in both logs. Of course, both logs started at different times, I have two hands and a forehead but only one mouse (No, both required a mouse click to start logging).
To make things worse, my locale is spanish (we are part of those people in the world that use the metric system and the comma to separate the decimal fraction from the integer part). One of the meters honored it and the other did not, so I had one log with commas and other with dots.
I am a gnuplot user and advocate, been using it for several decades now, but this seemed a bit hard for it; and particularly for myself using it. Enter vcdMaker and gtkWave.
vcdMaker can parse many logs, each one with its particular format, and merge them into a single variable change data format while keeping everything in sync. It does this by understanding time information based on how you teach it to get it. gtkWave can display that in a human understandable way like, let’s say, the graph for that wave… Since the hard part of the job is performed by vcdMaker, we’ll devote the rest of this “article” to celebrate how to get things done by taking advantage of this free (as in “free beer”) tool. (btw, gtkWave is free beer too)
The multimeter
Having set the microcontroller I/O to high-impedance, I measured the LDR resistance with my multimeter. This swiss-army knife has this usual oriental kindness and multipurpose universal problem solver sort of working, so the log is the same for all ways you can use it, and it is your problem to parse things… In this particular case, I’ve found it outputs something like this:
No    Time    DC/AC   Value   Unit    AUTO
 192    08:30:48 a.m.       206.7   k*  AUTO
 193    08:30:49 a.m.       203.0   k*  AUTO
 194    08:30:50 a.m.       198.5   k*  AUTO
 195    08:30:51 a.m.       426.5   k*  AUTO
 196    08:30:52 a.m.       0L. k*  AUTO
 197    08:30:53 a.m.       0.766   M*  AUTO
 198    08:30:54 a.m.       0.915   M*  AUTO
 199    08:30:55 a.m.       0.276   M*  AUTO
 200    08:30:55 a.m.       243.2   k*  AUTO
 201    08:30:56 a.m.       227.7   k*  AUTO
 202    08:30:57 a.m.       217.5   k*  AUTO
 203    08:30:58 a.m.       541.4   k*  AUTO
 204    08:30:59 a.m.       0L. k*  AUTO
 205    08:30:59 a.m.       1.981   M*  AUTO
A nice tab separated log with a human readable time stamp, and the quite useful range changes and overflow indication, in human readable form. That is exactly what you don’t want when you need machine parseable stuff… However, vcdMaker can parse this. A quick request to the author informed me that it can parse several indications to the same signal (and later I discovered sort of the opposite is also true), so handling Kohms and Mohms indications was a breeze.
I’m nil at regular expressions, and the vcdMaker config file is an XML that uses these for indications. So, don’t criticize me for being q&d, but this is what I came up with:
This takes care of parsing the two record types I’m interested in: the one reporting Kohm values and the one reporting Mohm values. As you can see, it is just a matter of catching fields and reference them later. The timestamp tag converts human readable times to seconds. (I’m busy enough to let the pm lines for later…)
Notice how both real entries reference the same variable name, so they merge into a single set of values. In case there are two records with the same timestamp, the most recent one takes precedence (replaces the older one).
The luminometer
This one is a bit more recent, so it made things worse… as it honored my locale. vcdMaker can handle dots or commas, but it will pass them as they are. In order to correctly merge both logs, one of them must be converted. Nothing that sed couldn’t do in a breeze:
sed -e 's/,/./g' < filewithcommas > filewithdots
The log format is something like this:
No    Time    Value   Unit

1    08:27:45    12,85   lux

2    08:27:46    12,68   lux

3    08:27:47    12,59   lux

4    08:27:48    12,59   lux
Quite more machine-friendly, but still bothersome. I came up with this config file:
Now we can either process both logs and see the signals (it is a good idea to try this first to check possible errors in the config file), by running vcdMaker with the -v option to be verbose. Or we can just go for it.
To merge both logs into one vcd file, while also checking we are on the right track:
Once we know what we are doing, we can remove the -v. But, wait! Where did all those names and numbers come from ?
-o ldr_r.vcd: the name of the output file, the one that will be the merged log, and we will open later with gtkWave.
U{ldr_r.xml},0,s,,,Hal/download/R.csv: the first log and all its parameters
U{ldr_r.xml}: the config file for this log
0: the time offset to sync with the other log(s)
s: the time unit we are using, seconds
Hal/download/R.csv: the name of the file for this log
U{ldr_lumi.xml},0,s,,,Hal/download/lumi.csv
yes, you can understand this one
Since both logs have a timestamp in “seconds since midnight” format, we can sync them at 0. Otherwise, we have to find that point in both logs and provide it here (what we will do in a followup ?). Caveat emptor: don’t work beyond midnight or you will have an overflow.
Those extra commas hide two useful parameters we don’t need right now. You can always go to the tool webpage and read the docs, don’t you ?
The analysis
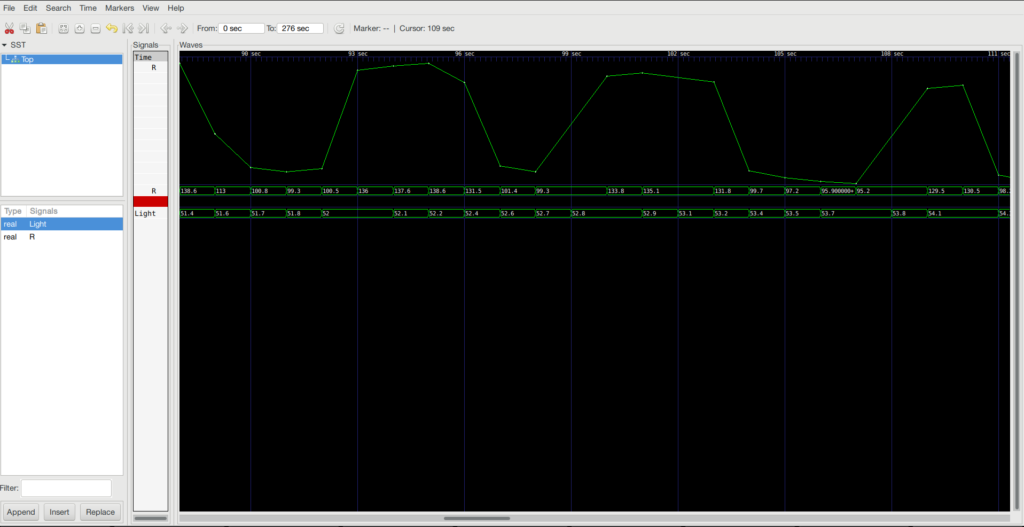
Now open gtkWave, open a new tab if necessary, load your vcd file, click on Top, append your signals, and…
Bingo! The resistance values change in accordance with the lighting of the LEDs… Proven.
To see the waveform, I added R two times, and in one of them, at the Signals, column, left-click selected Data format -> Analog -> Interpolated Annotated. Then, a series of left-click inserted Insert Analog Height Extension provides the necessary “zooming”.
As you can see, all signals are correctly time aligned while their values (or graph) are shown.
Behind the lines
I intentionally left some details out. vcdMaker generates vcd formatted files. That is normally used in the digital design world, so the words used in the documentation might be confusing if one does not understand a bit of that world. The same will happen with gtkWave.
Things can get a bit tougher, and that will be addressed in a followup.
Este jueves 18/10 estaremos por la UTN FRA en el marco de las Jornadas de Sistemas Embebidos, charlando sobre las peripecias a la hora de desarrollar sistemas dedicados con comunicaciones en entorno TCP/IP.
Este año, como siempre hasta ahora, estaremos dando algunos tutorial(e)s y workshops en el SASE. El workshop será el clásico de CMSIS y los tutorial(e)s serán uno sobre las penurias de utilizar TCP/IP en sistemas dedicados/embebidos/embedded y el otro sobre la realidad de la I(di)oT y sus opciones abiertas e ingenieriles.